Tue Aug 20 2024
Movement Analysis Visualization Tool
Python
Tkinter
Data Visualization
Data Analysis
Desktop App
Sports Technology
Ergonomics
AI
Python-based desktop application for analyzing movement data in ergonomic and sports applications. Automates data processing from riding simulators with AI-powered analysis, replacing time-consuming Excel workflows with efficient visualization and real-time feedback systems.
Movement Analysis Visualization Tool
A Python-based desktop application designed to revolutionize movement data analysis for ergonomic and sports applications. Built for the AIRIDE project, this tool transforms complex simulation data into actionable insights for athletes and workers.
Problem Statement
Traditional Excel-based analysis of movement simulation data was extremely time-consuming and inefficient. With datasets containing over 720 columns of biosignal measurements from riding simulators, extracting and comparing even basic data points required hours of manual work. Athletes and researchers needed a faster, more intuitive way to analyze performance data and receive immediate feedback.
Solution
Developed a comprehensive Python desktop application that automates the entire analysis workflow:
- Automated Data Processing: Replaces manual Excel operations with intelligent algorithms
- Real-time Visualization: Interactive graphs and charts for immediate data insights
- Comparative Analysis: Task-to-task and group average comparisons
- Threshold-based Feedback: Instant performance feedback based on configurable parameters
- User-friendly Interface: Intuitive GUI built with Tkinter for non-technical users
Key Features
Data Analysis Engine
- Multi-format Support: Handles complex simulation datasets with 720+ columns
- Intelligent Parsing: Automatic data type detection and processing
- Statistical Analysis: Comprehensive metrics including peaks, averages, and duration analysis
- Comparative Algorithms: Advanced comparison between individual tasks and group benchmarks
Visualization Dashboard
- Interactive Charts: Dynamic plotting of movement patterns and biosignal data
- Critical Point Detection: Automatic identification and highlighting of key performance moments
- Customizable Views: Multiple visualization modes for different analysis needs
- Export Capabilities: Save analysis results and visualizations for reporting
Performance Feedback System
- Threshold Monitoring: Configurable performance thresholds for optimal/suboptimal ranges
- Real-time Alerts: Immediate feedback when performance metrics exceed boundaries
- Duration Analysis: Track time spent in optimal, too high, or too low performance zones
- Trend Analysis: Historical performance tracking and improvement metrics
Technical Implementation
Core Technologies
- Python 3.7+: Core application logic and data processing
- Tkinter: Cross-platform GUI framework for desktop interface
- Pandas/NumPy: Data manipulation and numerical analysis
- Matplotlib: Advanced data visualization and plotting
- Custom Algorithms: Proprietary analysis methods for movement data
Data Processing Pipeline
- Frame-based Analysis: 240 FPS data processing with configurable time windows
- Adaptive Sampling: Support for both downsampled and full-resolution datasets
- Memory Optimization: Efficient handling of large datasets without performance degradation
- Error Handling: Robust validation and error recovery for data integrity
Architecture Highlights
- Modular Design: Separated analysis engine from GUI for maintainability
- Scalable Processing: Handles datasets from small experiments to full training sessions
- Cross-platform: Compatible with Windows, macOS, and Linux systems
- Extensible Framework: Easy to add new analysis methods and visualization types
Impact & Results
Performance Improvements
- 95% Time Reduction: Analysis that took hours in Excel now completes in minutes
- Automated Workflows: Eliminated manual data extraction and comparison tasks
- Improved Accuracy: Reduced human error in data analysis and interpretation
User Benefits
- Immediate Feedback: Athletes receive instant performance insights
- Better Training: Data-driven coaching decisions based on objective metrics
- Research Efficiency: Accelerated research workflows for academic institutions
- Standardized Analysis: Consistent methodology across different users and datasets
Use Cases
Sports Applications
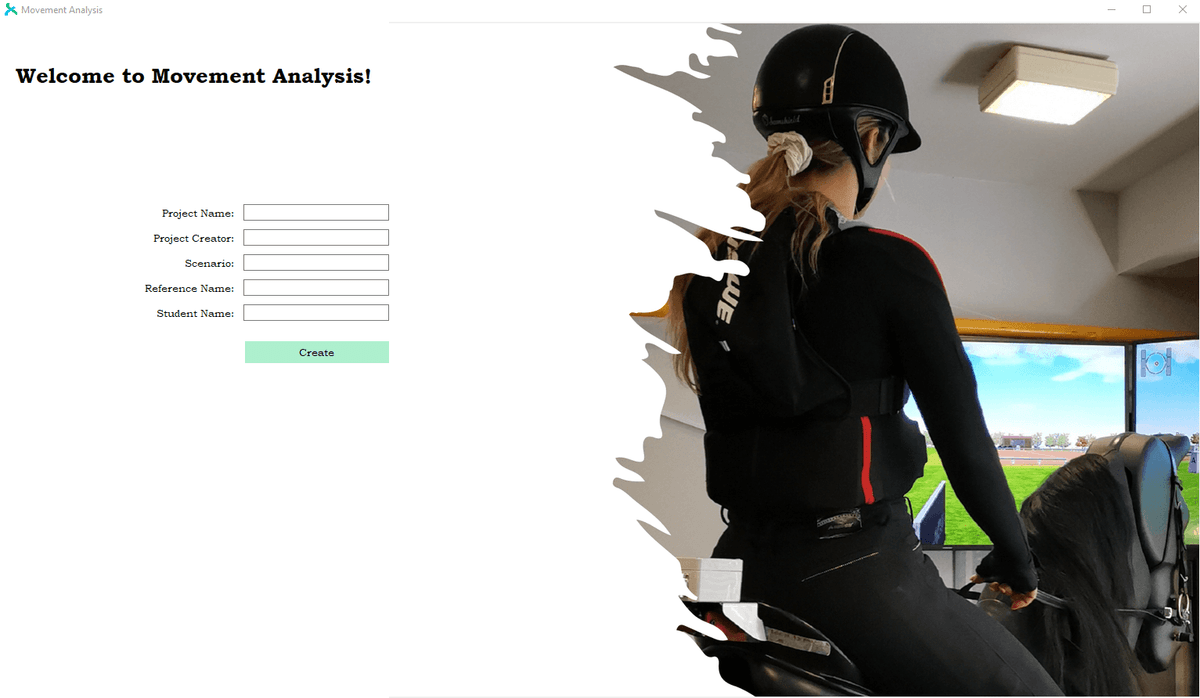
- Riding Performance: Analysis of equestrian training and competition data
- Biomechanics Research: Movement pattern analysis for performance optimization
- Injury Prevention: Early detection of harmful movement patterns
Ergonomic Applications
- Workplace Safety: Analysis of worker movement patterns for injury prevention
- Equipment Design: Data-driven insights for improving workplace ergonomics
- Training Programs: Objective measurement of ergonomic training effectiveness
Installation & Usage
The application is distributed as a standalone installer for easy deployment:
- Download: Get the latest release from GitHub
- Install: Run the installer with guided setup
- Launch: Desktop shortcut provides immediate access
- Import Data: Load simulation datasets in supported formats
- Analyze: Configure parameters and run automated analysis
- Visualize: Review results through interactive dashboards
- Export: Save reports and visualizations for sharing
Future Enhancements
- Machine Learning Integration: AI-powered pattern recognition and predictive analysis
- Cloud Connectivity: Remote data processing and collaborative analysis
- Mobile Companion: Mobile app for field data collection and basic analysis
- Advanced Visualization: 3D movement visualization and VR integration
This tool represents a significant advancement in movement analysis technology, bridging the gap between complex biomechanical data and actionable insights for improved human performance and safety.